Generalisation - Perturbed Set
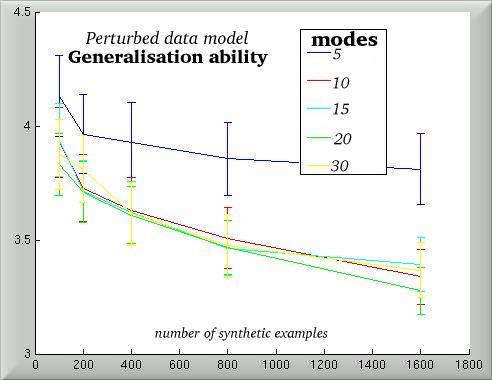
Generalisation of a model built from perturbed images. Values are shown for a different number of modes, as function of the number of model examples.
Generalisation - Registered Set
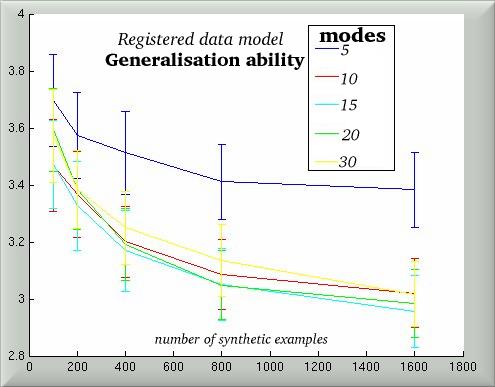
Generalisation of a model built from registered images. Values are shown for a different number of modes, as function of the number of model examples.
Specificity - Perturnbed Set
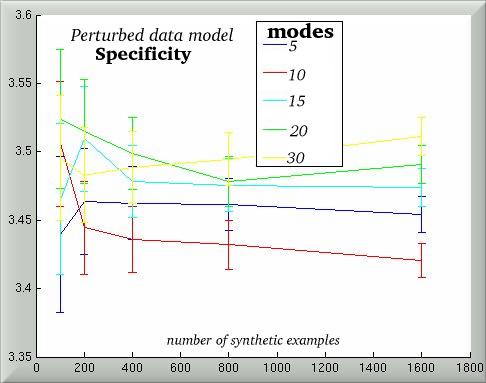
Specificity of a model built from perturbed images. Values are shown for a different number of modes, as function of the number of model examples.
Specificity - Registered Set
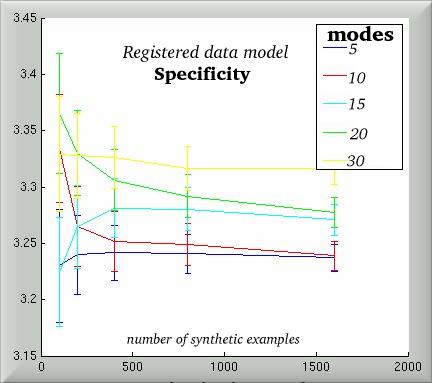
Specificity of a model built from registered images. Values are shown for a different number of modes, as function of the number of model examples.
Sensitivity and Syntheses - Graph #1
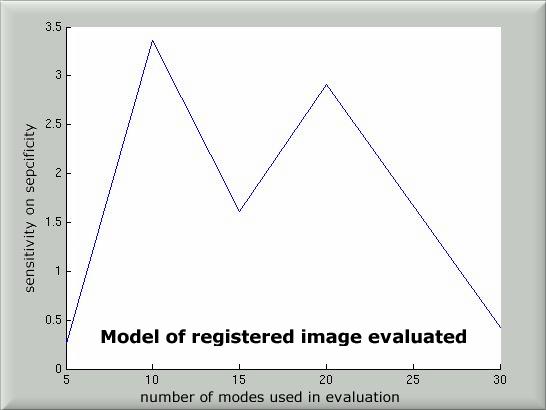
Sensitivity to change in number of model syntheses. Sensitivity is calculated over Specificity of a registered set model.
Sensitivity and Syntheses - Graph #2
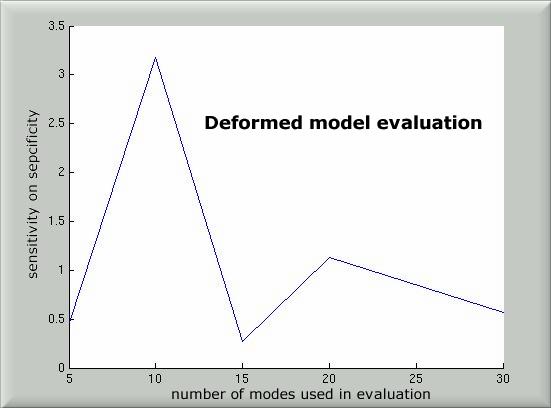
Sensitivity to change in number of model syntheses. Sensitivity is calculated over Specificity of a model of mis-registered images.
Number of Modes and Sensitivity - Results
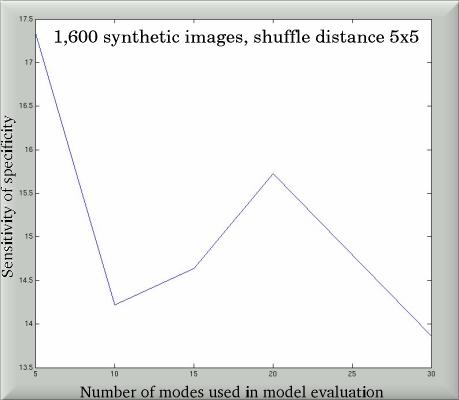
Specificity sensitivity in models is shown for different number of modes. Limited number of modes is of course used in an evaluation which is finite.
Bending Energy - Graph

The effect of the number of knot-points on bending energy in images
Label Propagation and Strong Edges
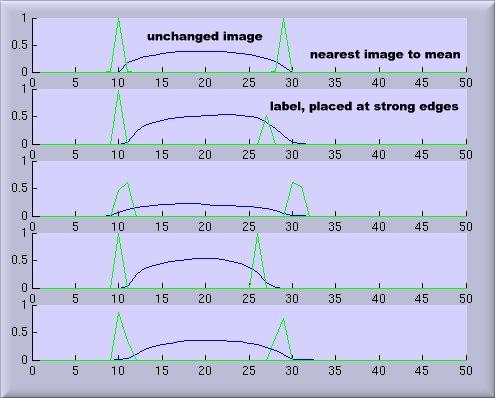
Selection of knot-points with placement on strong edges. Propagation of labels is shown after 5 warps were applied to each image.