PDF version of this entire document


The first of the proposed methods for assessing registration
quality uses a generalisation of Tanimoto's spatial overlap
measure [1]. We start with a manual mark-up of each
image, providing an anatomical/tissue label for each voxel, and
measure the overlap of corresponding labels following
registration. Each label is represented using a binary image, but
after warping and interpolation into a common reference frame,
based on the results of NRR, we obtain a set of fuzzy label
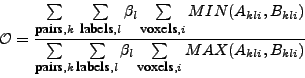
images. These are combined in a generalised overlap
score [5]:
 indexes voxels in the registered images,
 indexes the
label and
 indexes image pairs.
 and
 represent voxel label values in a pair of registered images and
are in the range [0, 1]. The
 and
 operators are
standard results for the intersection and union of fuzzy sets. The
generalised overlap measures the consistency with which each set
of labels partitions the image volume. The parameter
 affects the relative weighting of different labels. With
 , label contributions are implicitly volume weighted
with respect to one another. We have also considered the cases
where weights for the inverse label volume (which
makes the relative weighting of different labels equal), where
weights for the inverse label volume squared (which
gives labels of smaller volume higher weighting) and where
weights for a measure of label complexity (which we
define arbitrarily as the mean absolute voxel intensity gradient
in the label).
The second method assesses registration in terms of the
quality of a generative statistical appearance model, constructed
from the registered images - for all the experiments reported
here, this was an active appearance model
(AAM) [3]. The idea is that a correct
registration produces an anatomically meaningful dense
correspondence between the images, resulting in a better
appearance model of the anatomy. We define model quality using
two measures - generalisation and specificity. Both
are measures of overlap between the distribution of original
images and a distribution of images sampled from the model, as
illustrated in Figure 1. If we use the generative
property of the model to synthesise a large set of images,
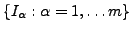 , we can define
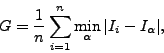
Generalisation
 as:
 |
(2) |
where  is a measure of distance between
images,
 is the
 training image, and
 is the minimum over
 (the set of synthetic images). That is, Generalisation is the average
distance from each training image to its nearest neighbour in the
synthetic image set. A good model exhibits a low value of ,
indicating that the model can generate images that cover the full
range of appearances present in the original image set. Given a sufficiently large synthetic set, even registered image with differing brightness levels will be paired with a nearby match. Similarly,
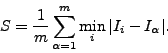
we can define Specificity
 as:
 |
(3) |
That is, Specificity is the average distance of each
synthetic image from its nearest neighbour in the original image
set. A good model exhibits a low value of , indicating that the
model only generates synthetic images that are similar to those in
the original image set. The uncertainty in estimating and
can also be computed.
In our experiments we have defined as the shuffle
distance between two images, as illustrated for a single pixel in
Figure 2. Shuffle distance images are formed by taking the mean of the
minimum absolute difference between each pixel/voxel in one image,
and the pixels/voxels in a shuffle neighbourhood of radius  around the corresponding pixel/voxel in a second image. When
 , this is equivalent to the mean absolute difference
between corresponding pixels/voxels, but for larger values of
the distance increases more smoothly as the misalignment of
structures in the two images increases. The effect on the
pixel-by-pixel contribution to the shuffle distance image as is
increased is illustrated in Figure 3.